What’s new in PostSharp 4.2
In the previous blog posts, I already announced the following improvements included in previous previews of PostSharp 4.2:
- Support for Visual Basic
- Ready-made patterns: amazing performance improvements
- Ready-made patterns: support for System.Collections.Immutable
- Ready-made patterns: support for programmatic rules
- Thread-safety policy
- INotifyPropertyChanged: support for INotifyPropertyChanging
- Module initializers
- OnAspectsInitialized advice
Today, I’m announcing the following new features:
- Code saving metrics
- Manual code metrics
- Customizable advice descriptions
Code Metrics
How much code do you really save using PostSharp? This is a central question: indeed, the total cost of ownership of custom-built software is roughly in linear dependence to its number of lines of code. We tried to answer this question statistically and very approximately based on data from our CEIP data and discovered it was not uncommon to save 20%. But yet, there were too many guesses, and we weren’t satisfied with the answer.
So we decided to bake code metrics directly into PostSharp, so you can know how much you save with PostSharp.
There are two locations where you can see code savings in Visual Studio: in tooltips, and in a new tool window.
Code Savings in Tooltips
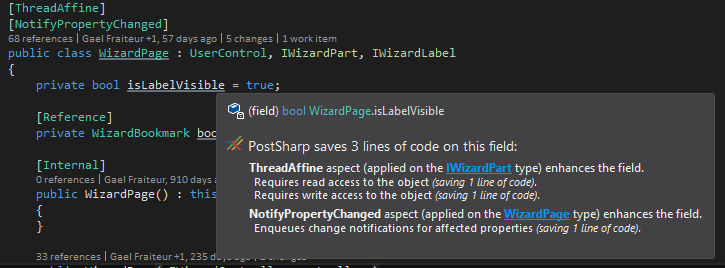
The first location where you will find code saving metrics is in the PostSharp-augmented tooltip. You will find detailed information about how individual aspects and advices affect the current piece of code:

Code Metrics Tool Window
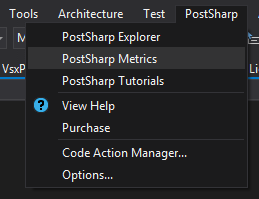
Tooltips are great when you want a detailed view, but sometimes you also need to get the big picture. That’s why we’re also displaying project-level metrics in a separate tool window. To open it, click on PostSharp / PostSharp Metrics in the Visual Studio menu.

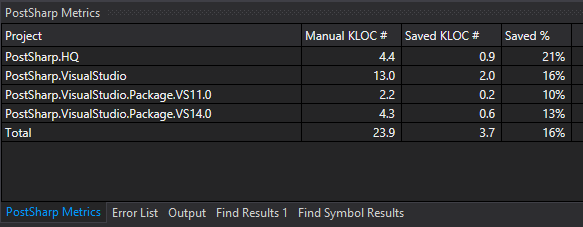
You can then see how much manual lines of code you have in each project, and how much additional code you would have to write if you didn’t use PostSharp:

About Lines of Code
Developers generally hate lines of code as a metric. I think there are two elements we need to address in this criticism: the intended use of the metric, and the algorithm used to compute the metric.
There are many bad uses of software metrics. Comparing productivity of individual developers is one of the worse. However, lines of source code is a decent metric to estimate the size of a project. Empirical studies show, ex post, a strong correlation between the number of lines of code and the total development effort. The intended use of metrics computed by PostSharp is to let you evaluate how efficiently you’re using aspects in your project.
People often argue that the LOC metric is highly sensitive to coding style (text formatting). PostSharp’s algorithm is absolutely insensitive to formatting. PostSharp does not directly counts lines of code in your text files, it actually sums the following:
- Debugging sequence points: every possible location of a breakpoint (or any possible step of an F10) is considered a line of code (minus two points per method, which are for the opening and closing brackets and don’t really map to source code). This is a very logical and natural way of computing the size of a program. It is quite close to the number of instructions.
- Declarations: we count one line of code per type, method, field, property, property getter, property setter, event, event adder, event remover – unless the declaration is compiler-generated. Abstract members are also counted because they should also be considered source code. Property and event accessors without body are not counted. Custom attributes are not counted because they are considered as modifiers, like readonly or private.
Therefore we can say that PostSharp computes the number of logical lines of code in your project. I believe it’s the best size metric possible.
Ready-Made Patterns
We added code saving information to all our ready-made patterns. It was sometimes difficult to take a decision on how many LOC to put because automatic code generation strategies greatly differ from manual generation strategies. When putting LOC numbers, we tried to answer the question: “How much code would I have to write if I had to implement the feature manually with the fewest number of LOC possible?”. This gives us much lower numbers than what we actually inject.
In general, you can consider that the code saving estimates for ready-made patterns are a very conservative estimate. You can convince yourself by looking at the tooltips: you will see that we actually do not push LOC saving for most advices.
You may be surprised to see how much code is generated by thread-safety aspects. First let me repeat that the estimate displayed in Visual Studio is very conservative for thread safety. However, much of this code is used by run-time validation, which is typically included in debug builds but not in release builds. For instance, for our PostSharp Tools solution, PostSharp saves 16% of code in debug build but only 8% in release build. That means that 8% is an overhead added to the debug build in order to deterministically detect potential model violations (and prevent data races). Does it mean that these 8% have no value? No of course, they do have enormous value, because they guarantee the thread safety of our release build.
Adding Code Saving Information to Your Aspects
Ready-made aspects are just a part of the story. Your custom aspects also participate in avoiding boilerplate code. To benefit from accurate code saving information, you will need to tell PostSharp how much lines are avoided every time your aspect is used.
The easiest way is to add the [LinesOfCodeAvoided] attribute to your aspect class.
[LinesOfCodeAvoided(2)]
public sealed class DispatchedMethodAspect : MethodInterceptionAspect
{
  // Details skipped.
}
The [LinesOfCodeAvoided(2)] custom attribute above instructs PostSharp to consider that 2 lines of code have been saved every time DispatchedMethodAspect is applied to a method.
If you have composite aspects in your code (the ones composed from several advices of the PostSharp.Aspects.Advices namespace), you can get more precise estimates by specifying how many lines of code are saved every time an advice is applied. Simply set the LinesOfCodeAvoided property of the advice custom attribute.
[OnLocationSetValueAdvice(LinesOfCodeAvoided = 2)]
[MethodPointcut( "SelectFields" )]
public void OnFieldSet( LocationInterceptionArgs args )
{
  // Details skipped.
}
In the code above, PostSharp will consider that 2 lines of code have been avoided every time that the OnFieldSet advice has been applied to a field.
Customizable Advice Descriptions
In the screenshots above, you can see that the description of advices now makes sense: the text actually says what the advice is doing. In previous versions of PostSharp, you would have got some text like “the field is intercepted by OnFieldSet”, which was not very useful if you didn’t write the aspect yourself. Now, you can add a custom description to your advices so the tooltips make sense.
To add a custom description to your advices, simply set the Description of the advice custom property. For instance:
[OnLocationSetValueAdvice(LinesOfCodeAvoided = 2,
                           Description = "Validates that the current thread has access to the object")]
[MethodPointcut( "SelectFields" )]
public void OnFieldSet( LocationInterceptionArgs args )
{
  // Details skipped.
}
Summary
Lies, damned lies, and code metrics. Counting logical lines of code is pretty straightforward and reliable, but it’s much more difficult and controversial to estimate how much code you avoided writing manually thanks to PostSharp. We understand there isn’t one right way to compute this estimate so we tried at least an educated but conservative guess.
We hope it will give you an idea of how PostSharp is useful in your projects.
However, keep in mind that reducing boilerplate is just one of the many benefits of PostSharp. According to most long-time customers, PostSharp’s first benefit is that source code is simpler, easier to read and understand – especially by new team members. And this is much more difficult to quantify.
Happy PostSharping!
-gael
