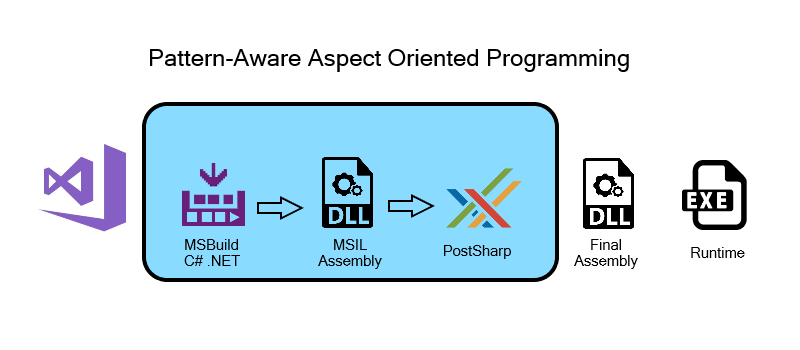
Whether you're just getting started with .NET or have been using it for its lifetime, there are concerns every project has to face eventually. In a previous article, I discussed how PostSharp can be used to target concerns like Logging and Threading. Today, I will show you how we can apply these same principles to Exception Handling to send real-time telemetry to Application Insights.
Remarks
Exception handling is a topic with depth far beyond the scope of this article. The code I reference here is not designed to be as fast or as efficient as possible. This is in the interest of showcasing each of the features and creating a usable demonstration which readers can then improve upon for their own purposes. You are always welcome to get in contact with me for clarification or advice on these topics; I also welcome you to point out errors, mistakes, or even make pull-requests to the repository as you see fit.
My goal is to explore .NET Core cross-platform capabilities and show you how Exception Handling can be integrated with the following tools:
- .NET Generic Host is an all-in-one package for handling configuration, dependency injection, logging, and other app startup concerns. If you want to host async services, then you can do it out of the box now with very little setup time. For us it will simplify a lot of the boilerplate needed to prototype interesting AOP use-cases.
- Azure Application Insights is a big suite of services which focus on monitoring performance in real-time. You can send events, metrics, and all sorts off custom measurements up to Azure and then immediately query it through Log Analytics. The goal here will be to handle our exceptions by logging them up in the cloud where we can get regular snapshots of the application’s state.
- Grafana is a wonderful open-source tool for creating dashboards which track metrics or visualize data as graphs. You can host it yourself but there is also a free and paid cloud-hosted option. The free option is ideal for prototyping and has all of the features we need for now.
Using the power of a pattern-aware compiler, this cross-cutting concern can be seamlessly hooked up to an external monitoring service without adding `try {} catch {}` blocks everywhere in your codebase. This lack of clutter helps to keep your code clear and understandable and reduces the number of concerns placed upon your team.
Before We Begin
Readers who wish to follow along should take the following steps to set up their environment:
- Download the .NET Core SDK and Runtime. I will be using VS 2017 on .NET Core SDK 2.2.106
- Download the latest stable PostSharp Extension from the VS Marketplace. Version 6.1.18 is used here.
- Clone the Semantic branch of my SharpCrafting repository or follow my previous article to build your own threaded Generic Host.
Understanding Pattern-Aware Exception Handling
An exception handler typically requires you to use some form of `try { } catch { } finally { }` statements which require every class to know its own context well enough to either bubble up, swallow, or handle an exception which occurs from within. An incorrectly handled exception can easily cause a service interruption or similarly poor experience for an end-user. This puts a burden of documentation and knowledge on any development team to understand the overall error-handling architecture outside the scope of any specific feature.
For example, in one solution alone I have found several hundred instances of `try { }` blocks. This can be rough if you run distributed, remote workers because the Exception may need to cross many boundaries without losing its original caller and state. Among those hundreds of `try { }` blocks there will undoubtedly be one or two which fail to handle as originally intended due to the slow feature creep of business needs. If those need ever change significantly then there is a risk that any one of handlers will be overlooked for compatibility. This can cause swallowed exceptions or an undecipherable call stack. The possibility of incorrectly handling exceptions becomes a major obstacle against refactoring and thus a tough sell for teams and project managers.
This is where aspect-oriented designs step in to provide a solution by consolidating your logic into a common place.
Handling Exceptions is a primary feature of the PostSharp namespace and I recommend reading it before continuing. The following objects are provided to us for a basic implementation:
- The OnExceptionAspect class which lives in PostSharp.Aspects. This defines an exception handler around a method which will intercept any thrown exceptions and can handle them at a higher level.
- The MethodExecutionArgs class which provides arguments containing advice for your handler. You can use these arguments to get the original exception, the arguments provided by the original caller to the intercepted method, and the flow behavior for execution.
The official PostSharp samples for Exception Handling are a great source to keep open alongside any documentation. I will borrow from the samples to show you an example of this implementation in action.
The first example is the "Add Context On Exception" Attribute. When an exception is intercepted by this attribute it will append the value of value of parameters to the exception. Having access to the argument values when reading over the exception later in the logs can save time debugging. This is an exceptional feature to have if you’re dealing with a bug that can’t be reproduced easily. In many cases it would have saved me hours of time to just know which arguments caused an exception in the first place.
This class has a few points of interest:
- First, it inherits the OnExceptionAspect class which provides an exception handler.
- Next, it intercepts exceptions thrown with `OnException( MethodExecutionArgs args )` and tracks their state with the `MethodExecutionArgs` mentioned earlier.
- Last, it builds a string containing the context including arguments, declaring type, generics, and method name. These are added to the Exception's `"Context"` index on the Data property.
The second example from the official samples is the "Report And Swallow Exception" Attribute. This one interacts directly with the previous attribute by reading the `"Context"` added by the handling peformed in the `AddContextOnException` attribute. A few things to note:
- The aspect declares an `[AspectTypeDependency]` which is a way to handle aspect dependencies on the same target. In this case it declares that it must come after the `AddContextOnException` attribute if applied to the same target.
- It checks to see if there is an `additionalContext` by checking the Exception's `Data` property for any information added earlier on via the `StringBuilder`.
Applying Our Understanding With Azure
While these samples may seem basic, this is all you need to immediately integrate your applications with third party tools. I find that Application Insights is perfectly suited for a task like this since it is designed to have a low barrier to entry with a simple API. Let's go over the next steps to see what our goals are and how we can implement them.
- An Azure account will be needed for this, but luckily it comes with a free trial and is quick to setup. If this is your first time then I recommend this video which shows you how to complete the entire process in just a few seconds.
- Create a new Application Insights resource through Azure. Grab the "Instrumentation Key" from the Overview page.
- Copy down your "Application ID" from the "API Access" menu of your Application Insights resource.
- Create an API key and copy it down as well. This can be done in the same "API Access" menu. Provide it all three options `[Read Telemetry, Write Annotations, and Authenticate SDK]`.
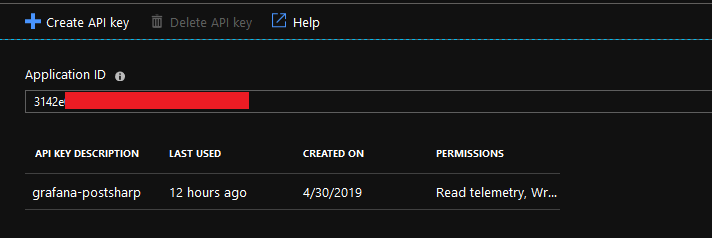
Example of the Azure API key for Application
ID.

Example of the Azure API key for
Instrumentation and Subscription.
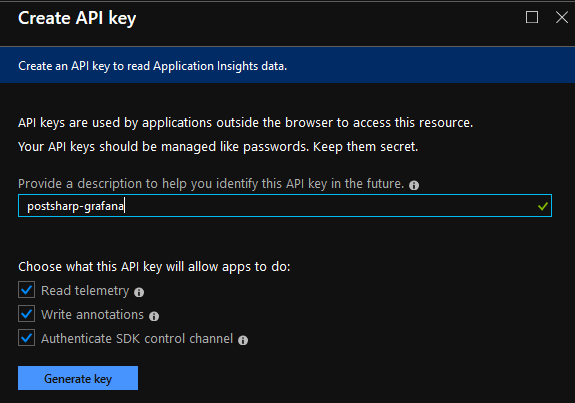
Example of creating an API key in Azure.
We'll use these pieces of information later to integrate our real-time metrics with Grafana. For now, store those keys in a safe place and let's revisit our code.
Integrating PostSharp With Azure
The goal here will be to write custom events to Azure describing an exception every time one is handled. We can restrict this to just two classes, one for Azure and one for the Exception Handler, by utilizing the OnExceptionAspect which we learned about earlier from the PostSharp samples. First, let's write an Aspect to do the following:
- Catch an exception.
- Read the arguments.
- Read the target name.
- Read the Exception type and its message.
- Mark a custom event with these properties on Azure and log them locally.
Let's break down this class to see where Azure was included specifically:
The MarkCustomEvent class separated out from the rest of the code. This prepares events for Azure.
We can see here that the Azure integration allows us to pass a dictionary of properties (similar to a JSON structure) into the custom event and all we have to do is give it a context. In this case the context is an "Exception". That's all there is to it! The only other configuration we need to connect to Azure is to add two files to our project. `Monitor.cs` and `ApplicationInsights.config`
The Monitor class separated from the repository. This sends events to Azure.
In the above code we just need to replace "Your Key Here" with the Instrumentation Key we pulled from Azure earlier. Then we add this `ApplicationInsights.config` file to the folder containing our `.csproj`.
Developer mode will allow the telemetry to be uploaded in near real-time so that we can test it quickly.
The Application Insights configuration file.
Again, replace "Your Key Here" with the “Instrumentation Key” provided by Azure. Please note: readers should store their keys in User Secrets or somewhere more secure; this code is used for examples only.
At this point the aspect is ready to send data to Application Insights. Decorate any method with `[ ServiceExceptionDetour ]` if you're using the code provided here and then throw an exception from that decorated method. For example:
Here you can see that I am using the lovely `ExceptionGremlin` from the HouseOfCat Library. The author provides a number of useful tools in there like basic exception fuzzing. Every time I throw from within this method, `CauseException`, it will be routed through the Exception Handler and have its data passed to Azure. You will also notice that it is decorated as an `[ EntryPoint ]` which means that it is safely entered from many threads in an actor model despite being private. It is important to understand the lifetime and scope of aspects when used in this way. For our purposes though we can disregard any performance issues because Exceptions are already expensive and we're not trying to be graceful here.
Log Analytics

This image shows how to reach Log Analytics from an
Azure resource.
If you navigate to Log Analytics on your Application Insights resource then you'll be able to query the `customEvents` table to see if everything worked. You should have `customDimensions` on each record which contains the data you attached to the event from the Exception when it was handled.

An example data structure for an
Application Insights custom event.
If you are new to Log Analytics then I recommend checking out the official Kusto Query Language (KQL) From Scratch tutorial on Pluralsight. Here is an example query for our current set of custom events:
An example query using Kusto Query Language.
Grafana
Finally, we can integrate our Log Analytics store with Grafana to produce beautiful, real-time dashboards for our exceptions. If you're new to Grafana then you can sign up for a free instance which is hosted as a container up in the company's cloud. You can also host an instance on your own machine if you'd like to make it a dedicated resource.
Once you have signed up then you will need to set up your dashboard to work with Azure.
- Install the Azure Monitor plugin on your instance of Grafana.
- Open your dashboard and navigate to Configuration > Data Sources. Add a data source for Azure Monitor.
- Fill out the two fields "API Key" and "Application ID" for Application Insights. We retrieved these keys earlier when we set up our Azure resource.
- Click "Save & Test" to check if the connection is working.
From here you can begin utilizing KQL queries to make new visualizations. Here are some examples of what can be constructed alongside the queries and settings I used to build them.
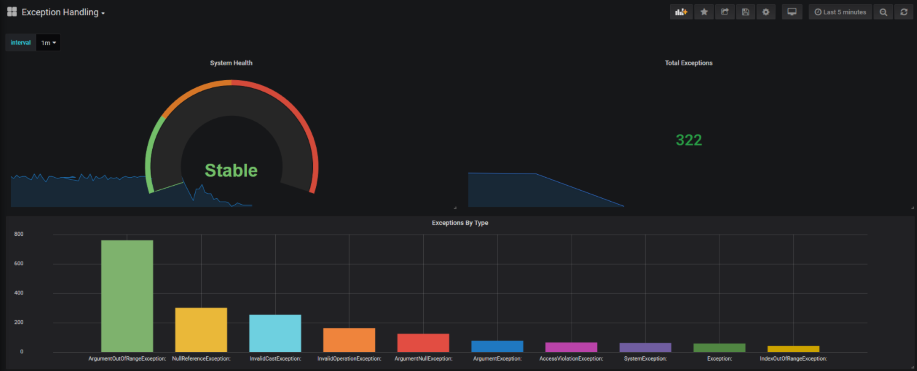
An example of Grafana visuals showing a stable
system.
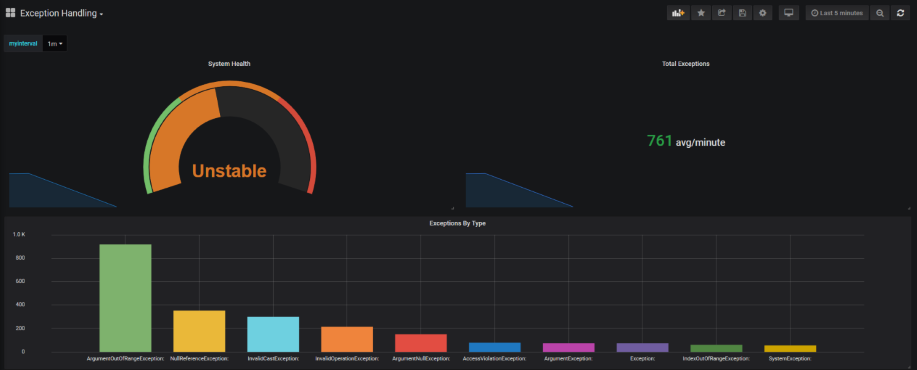
An example of Grafana visuals displaying an
unstable system.
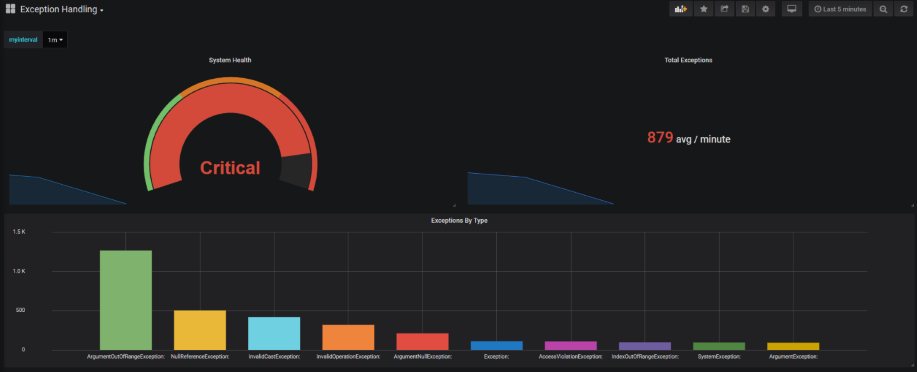
This example image shows what a
critical alert might look like.
Bar Chart:
A KQL query which works for building a bar chart data series.
Gauge & Annotation:
A KQL query which works for building a gauge with annotation data series.
Where Can I Go From Here?
At this point you can watch your data flow into the Grafana dashboard in real-time! This pipeline can now be used to track any sort of metric you want. PostSharp has a comprehensive suite of tools for you to inject behaviors before and after execution on methods, properties / fields, and events. Anywhere you want to gather metrics without re-writing your old classes is a place to consider using an Aspect to provide that advice.
Instead of writing out to Log Analytics, consider writing your events to EventStore which allows you to build an immutable timeline to be used as a source of truth later to reason about your events. The overhead on EventStore is exceptionally low to the point where it may be easier to scale this form of Exception Handling by writing to EventStore and then reading it into Azure from a separate service.
While there are many unconventional options, the goal here is simply to automate the boring stuff. Rather than chase down exceptions you can instead intercept them and handle them deterministically with advice provided by Attributes. How you handle them is up to your situation and needs.
Credit
Totem was used in this repository. It provides a way to host your assemblies on an event-sourcing timeline and integrates with most common development scenarios. This package is still in preview right now but I recommend you add it to your favorites and keep an eye on it.
HouseOfCat Library was used for exception generation here. I recommend checking out their Rabbit MQ library if you utilize message queues regularly.
Final Remarks
I will attach the source code for this entire project below if you’d like to clone it and play around with the solution. Feel free to modify or redistribute it as needed. You can always find a copy of it on the Semantic branch.
Hopefully this article conveyed the power of Aspect Oriented Programming in the .NET Core architecture. This is a learning process for all of us and I invite you to share or collaborate any time. Thank you for taking the time to read.
About the author, Alexander Johnston

Alexander is a .NET engineer who began writing code on Visual Basic 6.0 when he was ten years old. He spent the following ten years building online communities, hosting both Linux and Windows servers, and learning how to lead volunteer development teams. By the time he was in college he had contributed code full-time to several games and dropped out to pursue a career as a software engineer. His main focus is automating solutions to everyday problems by writing software with empathy for the user. Blog | LinkedIn
