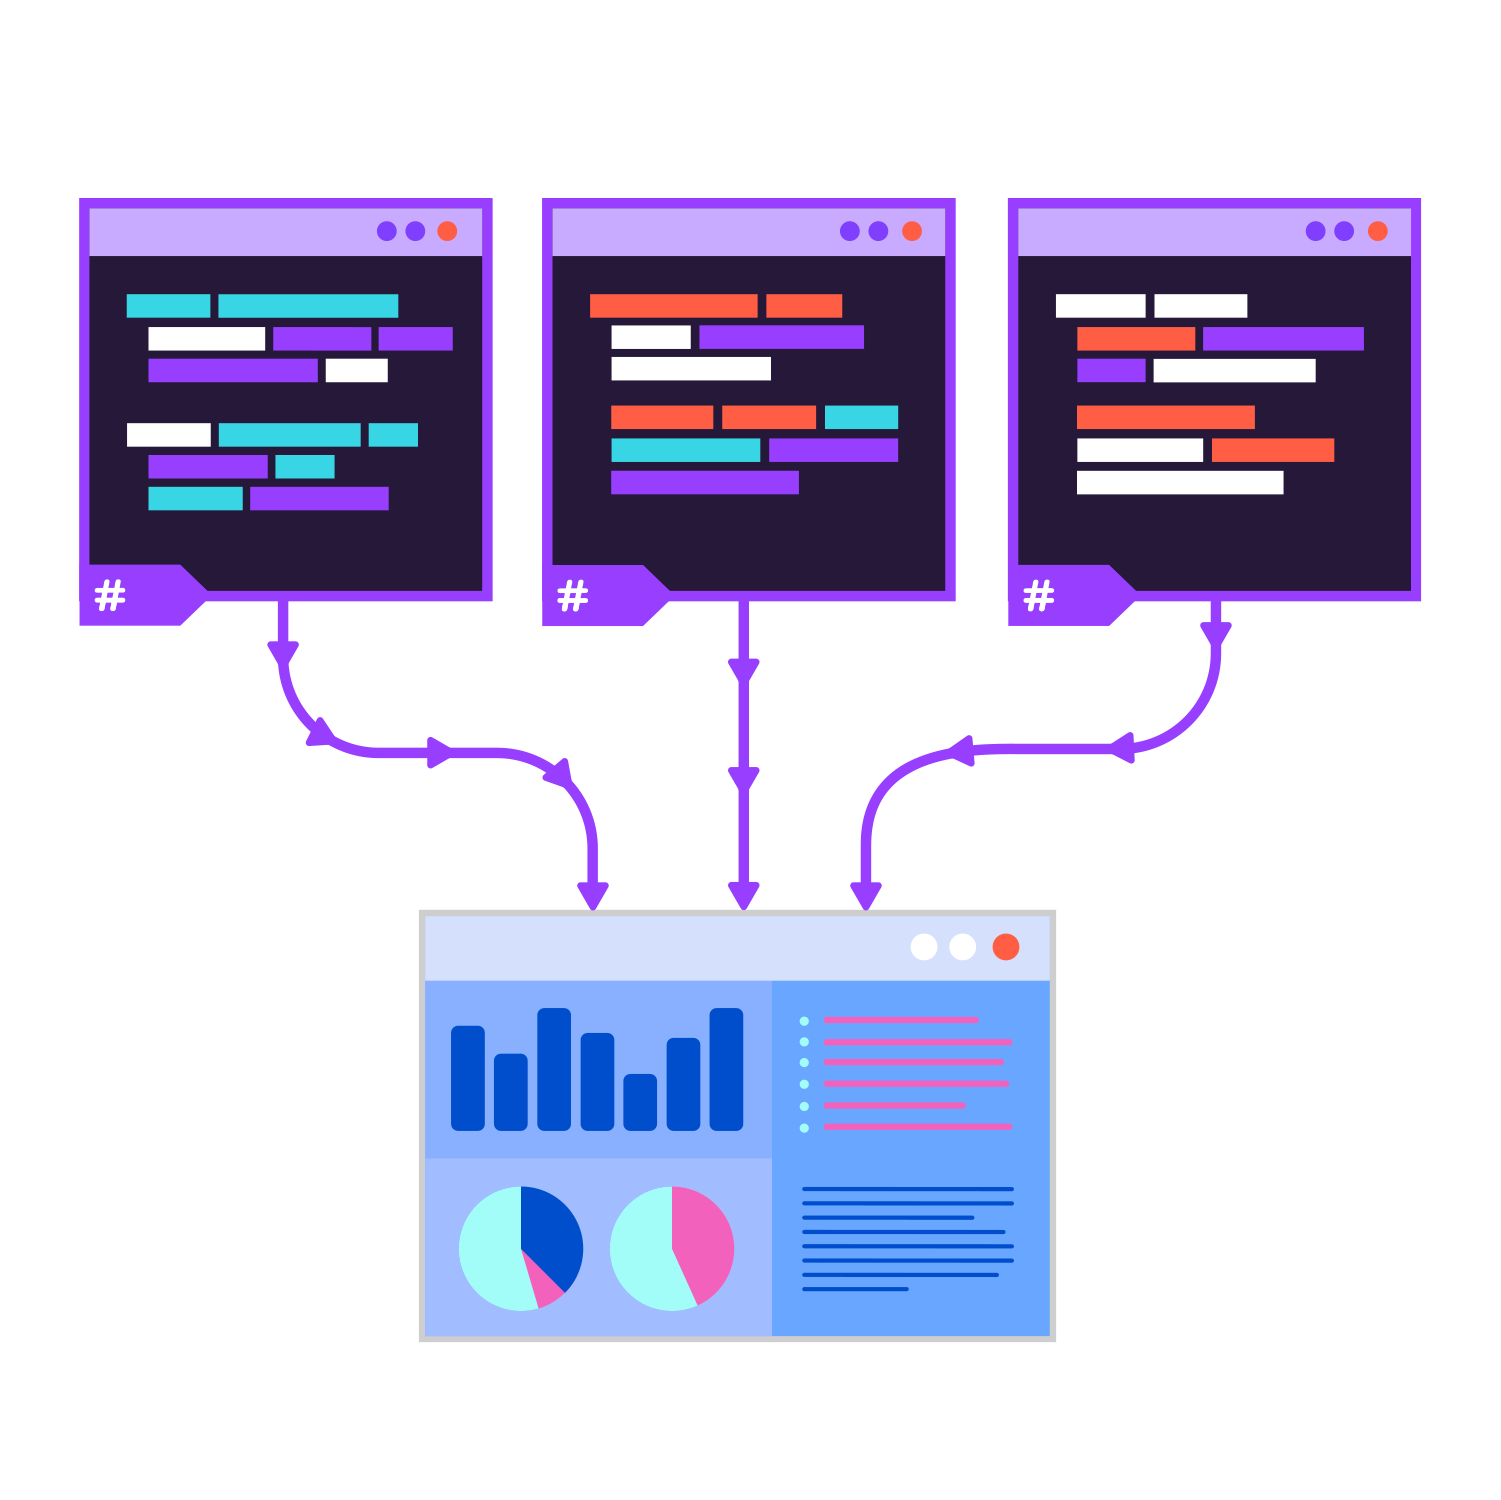
Logging in a distributed application used to be challenging. In a recent past, every application produced its own log files, and tracking a request across several log files was a painful task.
More and more vendors allow you to store logs from several applications in the cloud, or in a central database, which makes them easier to retrieve and analyze. Elasticsearch is an open-source document database that is often used to store distributed logs. Elasticsearch has an adapter for Serilog and is easy to use from .NET.
Even with Elasticsearch, the developer is still responsible of properly setting the correlation IDs and the cross-context properties. And, of course, as a developer you also have to add logging to your entire application – which takes a lot of effort and results in annoying boilerplate.
The mission of PostSharp Logging has always been to add logging to your apps automatically, without affecting your source code. Starting with version 6.8, it also integrates much better with scenarios of distributed logging.
The rest of this article is based on a sample available on GitHub. This sample is composed of a command-line client and an ASP.NET Core Web API. In the rest of this article, for simplicity, we will assume that every role of your application is both a client and a server.
Step 1. Add logging to all projects (including class libraries)
-
Add the
PostSharp.Patterns.Diagnosticspackage to all projects that you want to log. -
Add the following custom attributes to your code. This will add logging to everything (really, every single method) but property getters or setters. You will likely need to tune this code to improve the signal-noise ratio.
 using PostSharp.Patterns.Diagnostics;

 // Add logging to everything
 [assembly:Log(AttributePriority = 0)]

 // Remove logging from property getters and setters
 [assembly:Log(AttributePriority = 1,
     AttributeExclude = true, AttributeTargetMembers = "regex:get_.*|set_.")]
Step 2. Configure web projects
-
Add the following packages:
PostSharp.Patterns.Diagnostics.HttpClientPostSharp.Patterns.Diagnostics.AspNetCorePostSharp.Patterns.Diagnostics.SerilogSerilog.Extensions.LoggingSerilog.AspNetCodeSerilog.Sinks.ConsoleSerilog.Sinks.ElasticSearch
-
Initialize Serilog in your
Program.Main. We set up two sinks: the console, and Elasticsearch.using var logger = new LoggerConfiguration() .Enrich.WithProperty("Application", typeof(Program).Assembly.GetName().Name) .MinimumLevel.Debug() .WriteTo.Elasticsearch(new ElasticsearchSinkOptions(new Uri("https://localhost:9200")) { BatchPostingLimit = 1, // For demo. AutoRegisterTemplate = true, AutoRegisterTemplateVersion = AutoRegisterTemplateVersion.ESv6, EmitEventFailure = EmitEventFailureHandling.ThrowException | EmitEventFailureHandling.WriteToSelfLog, FailureCallback = e => Console.WriteLine("Unable to submit event " + e.MessageTemplate), }) .WriteTo.Console( outputTemplate: "{Timestamp:yyyy-MM-dd HH:mm:ss} [{Level:u3}] {Indent:l}{Message:l}{NewLine}{Exception}") .CreateLogger()) -
Configure PostSharp Logging
var backend = new SerilogLoggingBackend(logger); backend.Options.IncludeActivityExecutionTime = true; backend.Options.IncludeExceptionDetails = true; backend.Options.SemanticParametersTreatedSemantically = SemanticParameterKind.All; backend.Options.IncludedSpecialProperties = SerilogSpecialProperties.All; backend.Options.ContextIdGenerationStrategy = ContextIdGenerationStrategy.Hierarchical; LoggingServices.DefaultBackend = backend; -
Set up PostSharp Logging to capture outgoing and incoming HTTP requests. To enable correlation, we have to pass an implementation of the
ICorrelationProtocol. The only one that’s available out of the box isLegacyHttpCorrelationProtocol, which is called legacy because this is how it is called in .NET (the specification of the replacement is not yet final):AspNetCoreLogging.Initialize( correlationProtocol: new LegacyHttpCorrelationProtocol() ); HttpClientLogging.Initialize( correlationProtocol: new LegacyHttpCorrelationProtocol(), requestUriPredicate: uri => uri.Port != 9200);
Your web projects startup code should look now like this:
public static void Main(string[] args)
{
      // Configure Serilog to write to the console and to Elastic Search.
      using var logger = new LoggerConfiguration()
            .Enrich.WithProperty("Application", typeof(Program).Assembly.GetName().Name)
            .MinimumLevel.Debug()
            .WriteTo.Elasticsearch(new ElasticsearchSinkOptions(new Uri("https://localhost:9200"));
                  BatchPostingLimit = 1, // For demo.
                  AutoRegisterTemplate = true,
                  AutoRegisterTemplateVersion = AutoRegisterTemplateVersion.ESv6,
                  EmitEventFailure = EmitEventFailureHandling.ThrowException | EmitEventFailureHandling.WriteToSelfLog,
                  FailureCallback = e => Console.WriteLine("Unable to submit event " + e.MessageTemplate),
                  })
            .WriteTo.Console(
                  outputTemplate:
                  "{Timestamp:yyyy-MM-dd HH:mm:ss} [{Level:u3}] {Indent:l}{Message:l}{NewLine}{Exception}")
            .CreateLogger();

      // Configure PostSharp Logging to write to Serilog.
      var backend = new SerilogLoggingBackend(logger);
      backend.Options.IncludeActivityExecutionTime = true;
      backend.Options.IncludeExceptionDetails = true;
      backend.Options.SemanticParametersTreatedSemantically = SemanticParameterKind.All;
      backend.Options.IncludedSpecialProperties = SerilogSpecialProperties.All;
      backend.Options.ContextIdGenerationStrategy = ContextIdGenerationStrategy.Hierarchical;
      LoggingServices.DefaultBackend = backend;

      // Instrument incoming HTTP requests.
      AspNetCoreLogging.Initialize();

      // Instrument outgoing HTTP requests but not those to Elasticsearch.
      HttpClientLogging.Initialize(uri => uri.Port != 9200);

      // Execute the web app.
      CreateWebHostBuilder(args).Build().Run();
}
Step 3. Start the Elastic stack
Before you run the projects, you need to start the Elastic stack. It is composed of three services: Elastic Search is the document database, Logstash is the ingestion servie, and Kibana is the dashboard (it’s also called the ELK stack).
If you don’t have a working ELK stack already, you can get configure one quickly thanks to Docker:
- Clone the PostSharp.Samples repo from GitHub.
- Open a command prompt with elevated privileges.
- Go to the PostSharp.Samples/Diagnostics/PostSharp.Samples.Logging.ElasticStack/elastic-stack/ directory.
- Execute this command:
docker-compose up
See README.md for details.
Step 4. Start your distributed application
We’re now ready. Start all components of your applications.
In our example, this is done using dotnet run.
Then execute a few requests to fill the logging server.
Step 5. Visualize the results in Kibana
-
Open Kibana using your web browser at https://localhost:5601/.
-
If it’s the first time you’re opening this Kibana instance, you will need to define an index. Use the pattern
logstash-*and the Fime Filter field@timestamp. -
Go to Discover. You can see a lot of records.
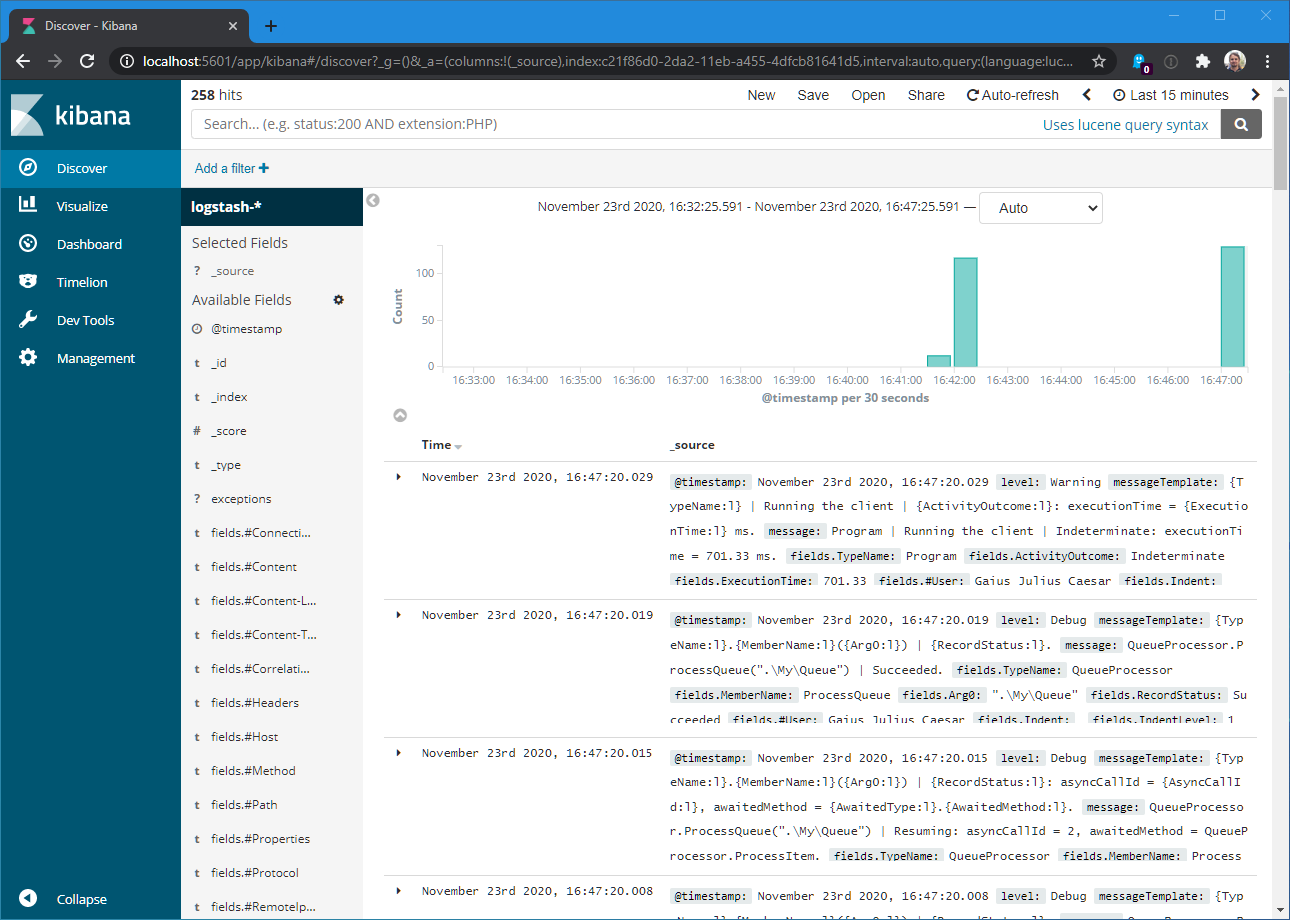
Here is the detail of one of those records:
{ "_index": "logstash-2020.11.23", "_type": "logevent", "_id": "QfLJ9XUBRLWFASabvGNb", "_version": 1, "_score": null, "_source": { "@timestamp": "2020-11-23T16:47:20.0195192+01:00", "level": "Debug", "messageTemplate": "{TypeName:l}.{MemberName:l}({Arg0:l}) | {RecordStatus:l}.", "message": "QueueProcessor.ProcessQueue(\".\\My\\Queue\") | Succeeded.", "fields": { "TypeName": "QueueProcessor", "MemberName": "ProcessQueue", "Arg0": "\".\\My\\Queue\"", "RecordStatus": "Succeeded", "#User": "Gaius Julius Caesar", "Indent": " ", "IndentLevel": 1, "EventId": "|4e361fe67f.a2.a3.b36.", "SourceContext": "ClientExample.QueueProcessor", "Application": "PostSharp.Samples.Logging.Distributed.Client" }, "renderings": { "TypeName": [ { "Format": "l", "Rendering": "QueueProcessor" } ], "MemberName": [ { "Format": "l", "Rendering": "ProcessQueue" } ], "Arg0": [ { "Format": "l", "Rendering": "\".\\My\\Queue\"" } ], "RecordStatus": [ { "Format": "l", "Rendering": "Succeeded" } ] } }, "fields": { "@timestamp": [ "2020-11-23T15:47:20.019Z" ] }, "sort": [ 1606146440019 ] } -
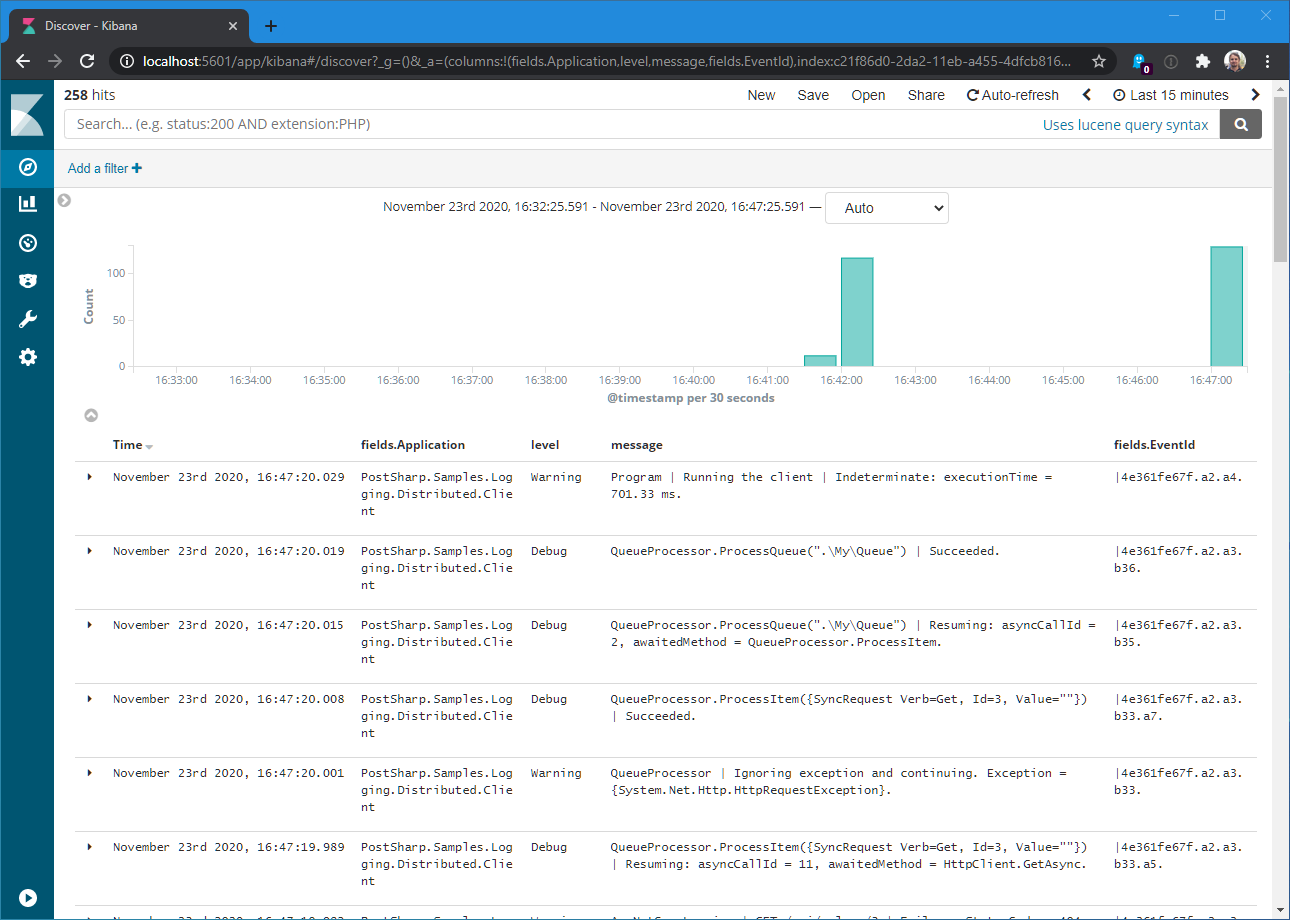
Add a few interesting columns to the table:
fields.Application: the name of the originating applicationlevel: the severity of the messagemessage: the human-readable messagefields.EventId: a hierarchical identifier
Step 6. Isolate a specific request
So far we’ve been able to gather a long list of log requests, but what if we want a consistent view of a single request?
This is simple thanks to the fields.EventId property. This identifier is synthetic, i.e. made of several
parts, and cross-process. And the identifier of child activity or scope always starts with the identifier of
its logical parent, even if it resides in a different process. To filter all log records of a single request,
we need to find the identifier of the root node we’re interested in, then look for all log records whose identifer
starts with the parent identifier.
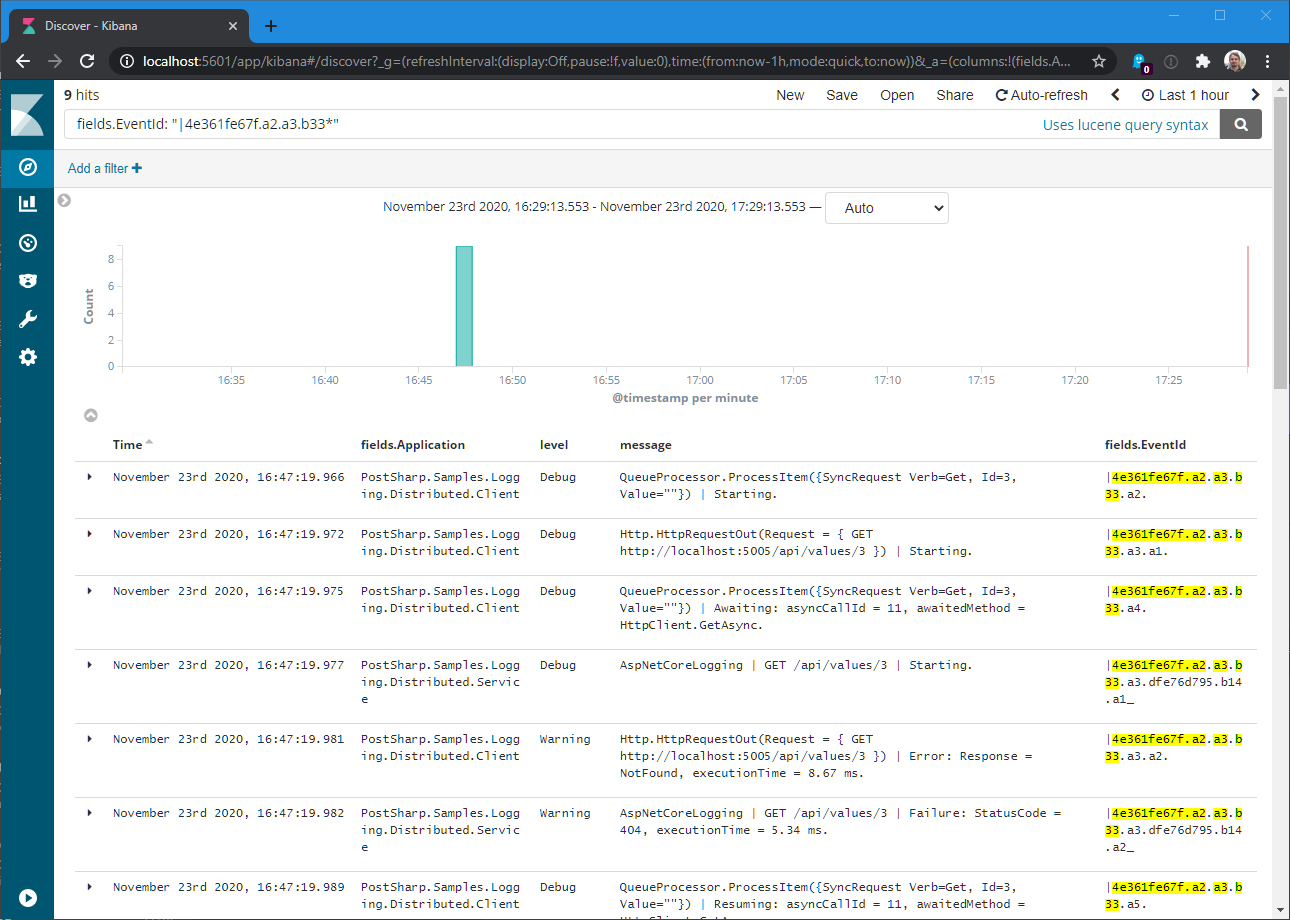
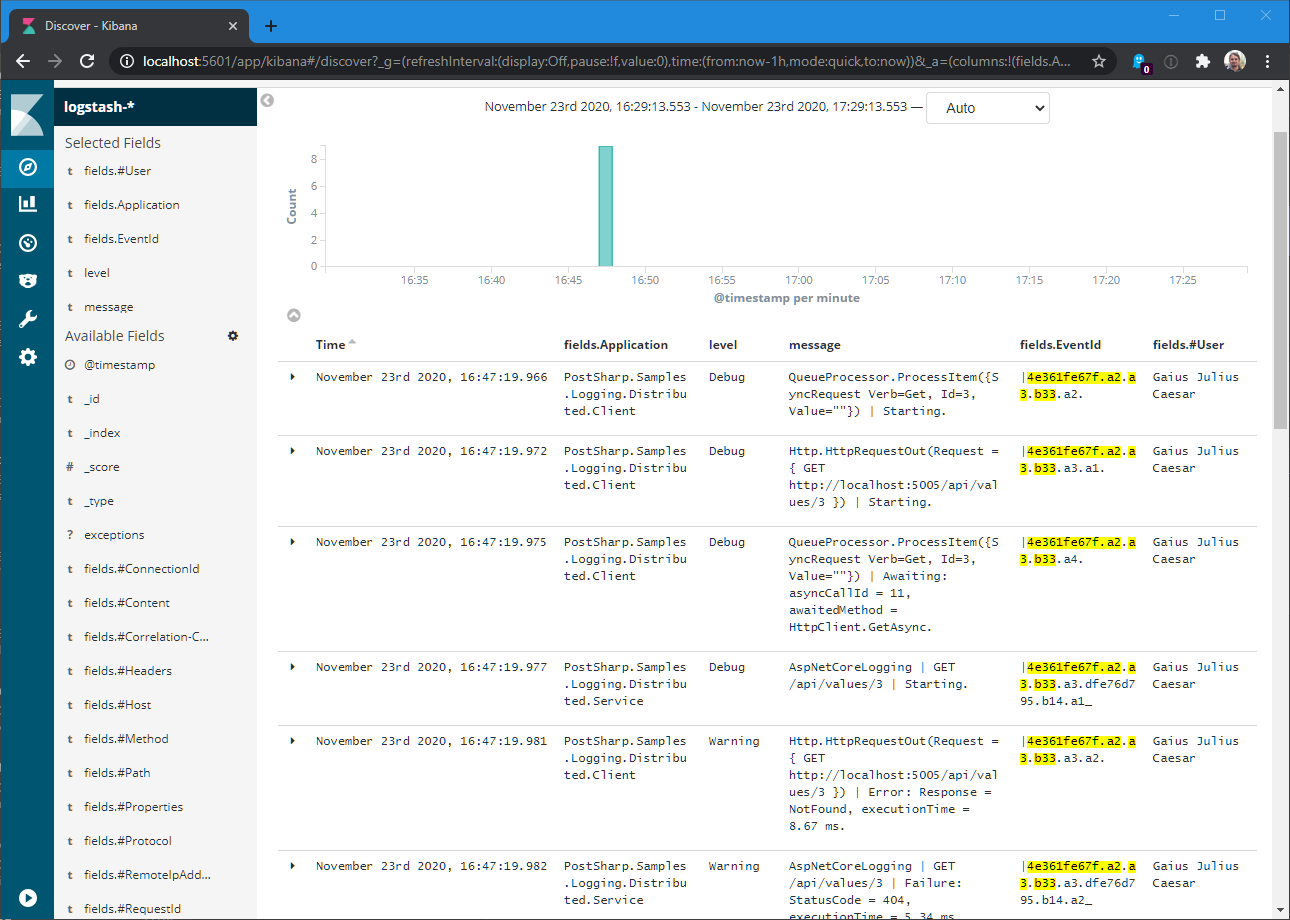
In Kibana, you can type an expression like this in the search box (you will have to adjust the identifier):
fields.EventId: "|4e361fe67f.a2.a3.b33*"
This now gives us a consistent view of the request processing:
Step 7. Add a cross-process logging property (aka baggage)
It’s often useful to include in each log the name of user who has initiated the request. However, the user identity
may not flow through the whole application. With PostSharp Logging, you can mark a property as being a baggage,
which means that you want it to be transferred across processes. When you define a property as a baggage,
HttpClientLogging will add it to the Correlation-Context HTTP header, and AspNetCoreLogging will read
this header and interpret it properly.
Here is how to define a baggage for an execution context:
-
Define a class with all needed properties. Exclude this class from logging and mark the cross-process properties with ` [LoggingPropertyOptions(IsBaggage = true)]`.
[Log(AttributeExclude = true)] class Baggage { [LoggingPropertyOptions(IsBaggage = true)] public string User { get; set; } } -
Wrap the activity with a call to
OpenActivityand pass this baggage:public class MyClass { private static readonly LogSource logSource = LogSource.Get(); private async Task ProcessRequest() { // ... using (logSource.Debug.OpenActivity(Formatted("Processing the request.."), new OpenActivityOptions(new Baggage { User = "Gaius Julius Caesar" }))) { await QueueProcessor.ProcessQueue(".\\My\\Queue"); } } }
You can consider building this code into an ActionFilter or a PageFilter.
If you now run your distributed application, you can add fields.#User as a new column and see that the property
is being preserved across processes:
Step 8. Configure per-request logging
You now probably have way too much logging in your application. Even if Elasticsearch is open source, operating a node in production is not cheap because of the resources it consumes. Therefore, you will need to keep your database within a manageable size: probably a few gigabytes. Therefore, it’s desirable to only log the requests that are important to you.
PostSharp Logging can be configured to log every request with a different level of verbosity – for instance
just warnings by default, but everything for the /invoice API when it comes from the IP 12.64.347.3. Details in this blog post.
Summary
Producing a highly-detailed log of a distributed .NET application has become much simpler with PostSharp 6.8. By adding two packages to your project – one for incoming HTTP requests and one for outgoing requests – and calling their initialization method (one for the server), PostSharp Logging will start producing cross-process event identifiers that are easy to filter. It also supports baggage, i.e. cross-process logging properties.
Happy PostSharping!